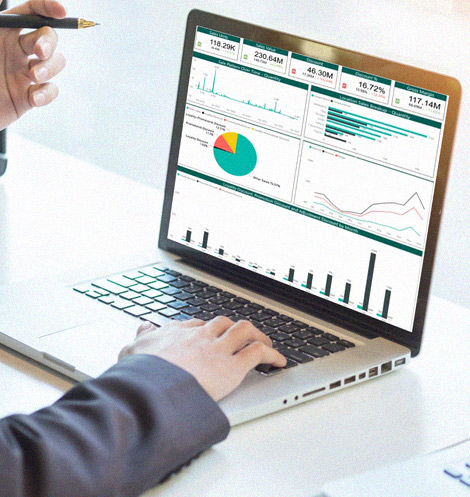
Default BI Management Dashboard
The default management dashboard of Candela BI provides a combined view of all relevant KPIs and trends. It offers a view of historical and real-time metrics for key performance indicators and data points.

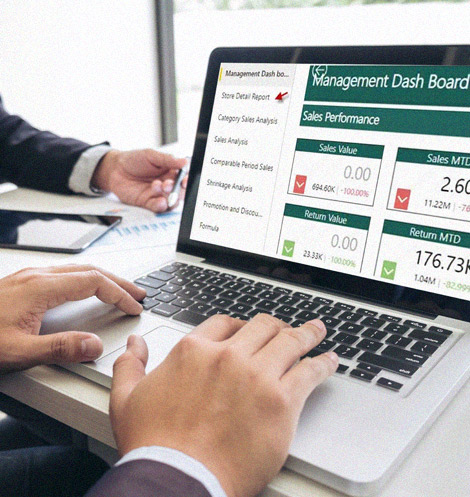
Drill-down Functionality
Users can explore deeper into data granularity by opting for the 'view as tables' feature. This option presents relevant data points and visuals in tabular format, allowing actionable insights.

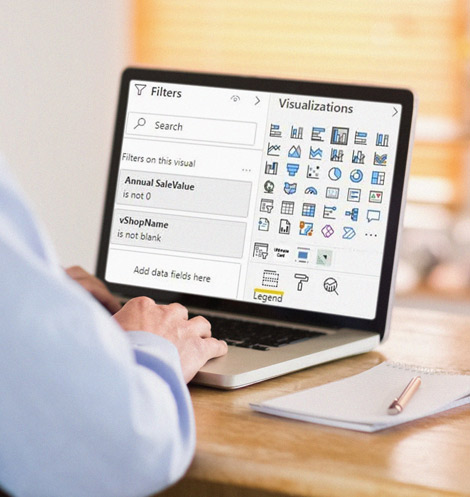
Data Filters
Flexible data filters and slicers enable users to choose a date range and incorporate additional data fields on specific pages or throughout the entire dashboard, as well as filter data based on other parameters.
Data Visualization
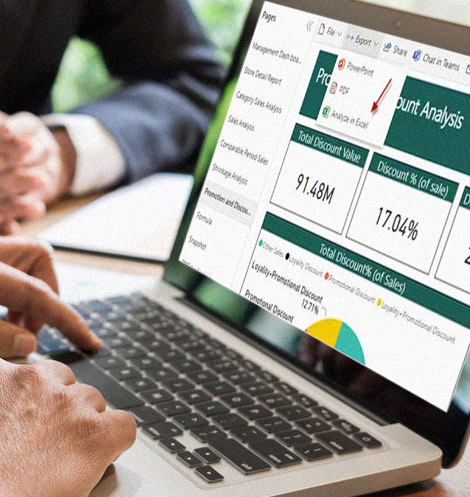
The dashboards show various visualizations to represent different KPIs. Color-coded graphics such as bar charts, line charts, pie charts, and more intricate visuals like scatter plots and filled maps are used to illustrate performance.
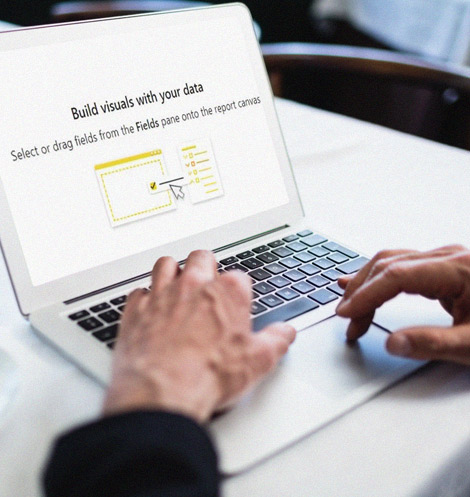
Dashboard Customization
Users can fashion customized dashboards from scratch or by pinning the essential metrics and data graphics that are needed and can save them to a new dashboard.
Export reports
In-depth excel analysis can be conducted on reports saved in excel format. A QR code for a specific report can also be generated.